


All our customers get rewards as standard
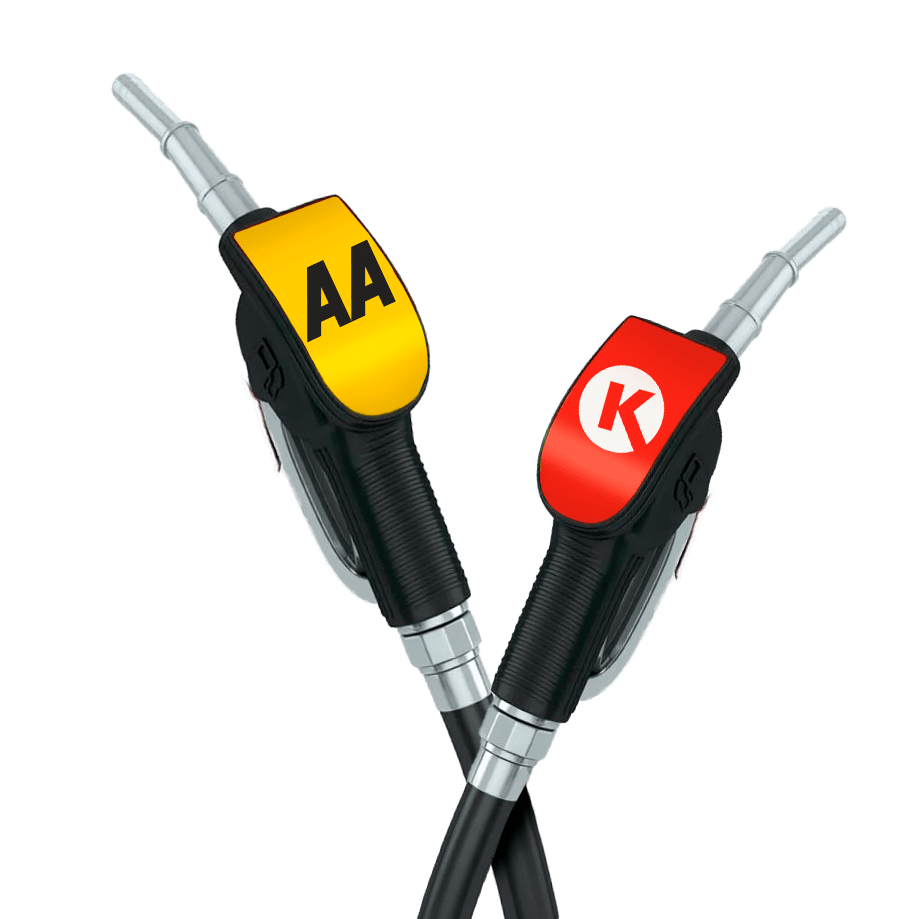
RelAAX!, Yellow and black have got your back. We give all our customers extra rewards as standard. Like up to 6c off every litre of fuel at CircleK, Nice


RelAAX!, Yellow and black have got your back. We give all our customers extra rewards as standard. Like up to 6c off every litre of fuel at CircleK, Nice